About Project
This project involved working with a logistics company to analyze their bank statement and generate actionable financial insights. I was given access to their transaction data in PDF format and was responsible for extracting, cleaning, and transforming it into an analyzable structure using Excel Power Query. From there, I used MySQL to perform deeper analysis, identifying trends in income and expenses, monitoring cash flow, and highlighting areas where the business could optimize spending.
To present the insights effectively, I designed a clean, dark-themed dashboard using Google Looker Studio. The dashboard showcases total inflow and outflow, transaction types and patterns, top beneficiaries, daily/quarterly volume trends, and institution analysis. This project helped the client gain clarity on their financial habits and patterns, while also strengthening my skills in data extraction, transformation, SQL analysis, and visualization.
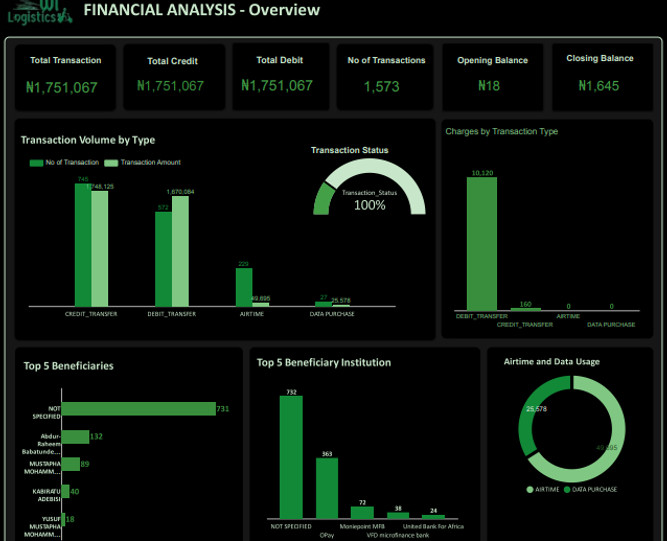
Financial Analysis Overview
This page highlights key summary metrics, including total inflow, total debit, number of transactions, and balance movement. It also features visual insights like the top 5 beneficiaries, top beneficiary institutions, transaction status, and airtime/data usage, helping stakeholders quickly grasp the company’s key expense and income trends.
NB: Please click on the image below to see the full view of the dashboard report.
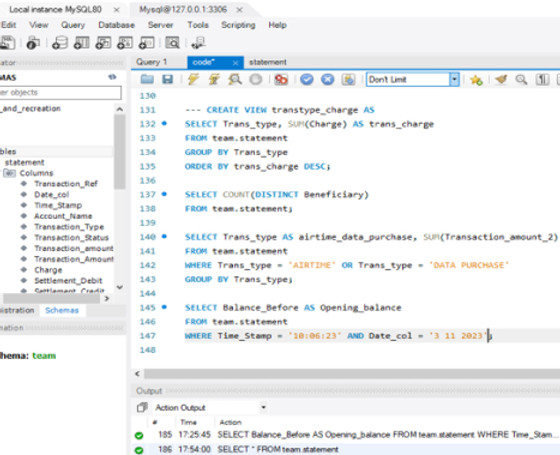
Transaction Analysis SQL
This section dives into transaction types (credit, debit, airtime, data) showing both transaction count and monetary value. It also analyzes transaction timing (morning, afternoon, evening), daily transaction patterns across the week, and quarterly financial activity to uncover seasonal or behavioral trends.
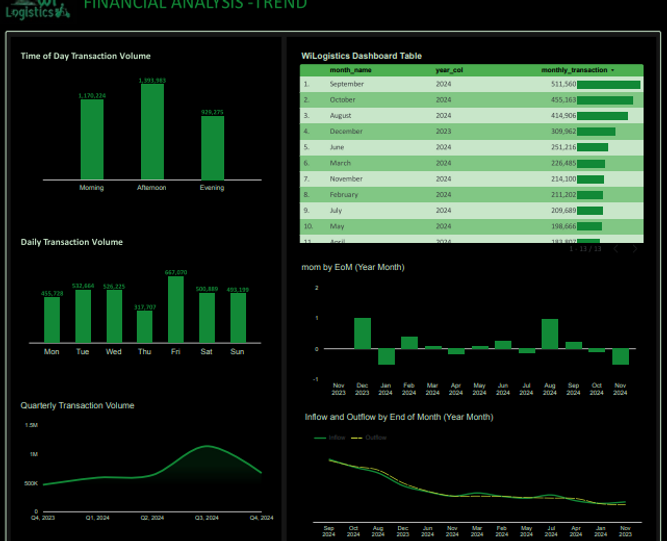
Monthly Trend & Comparison
This page offers a breakdown of monthly transaction volume, top-performing months, and month-over-month trends using line and bar charts. It also compares inflow vs. outflow by month, giving stakeholders a clearer picture of cash flow rhythm throughout the year.
NB: Please click on the image below to see the full view of the dashboard report.