About this Project.
This Power BI project analyzes 55,500 unique patient records from 10 major hospitals across the U.S., covering a wide range of data including hospital admissions, medical conditions, treatment costs, and medications. The goal was to uncover data-driven insights that support smarter healthcare decisions, improve patient outcomes, and optimize treatment costs.
Across three interactive dashboards, the analysis highlights patterns in patient demographics, frequently diagnosed conditions, average length of hospital stay, cost variations, and hospital performance metrics. It also reveals trends in medication usage and admission types, providing a comprehensive view of hospital care delivery.
This project demonstrates my ability to transform complex healthcare data into clear, actionable visual stories that can inform policy, resource planning, and quality improvement efforts.
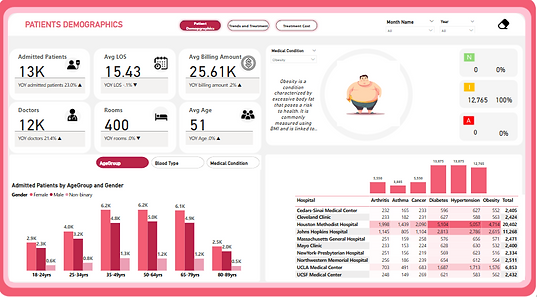
Patients and Demographics
This dashboard provides an overview of patient demographics across 10 major hospitals. It breaks down admissions by age group, gender, and blood type, helping identify which populations are most frequently admitted. It also highlights the dominant type of hospital admission, emergency, urgent, or planned, and shows how these admission types are distributed across age and gender. This visualization helps stakeholders understand who the core patients are and the nature of their hospital visits, which is key for resource planning and targeted healthcare programs.
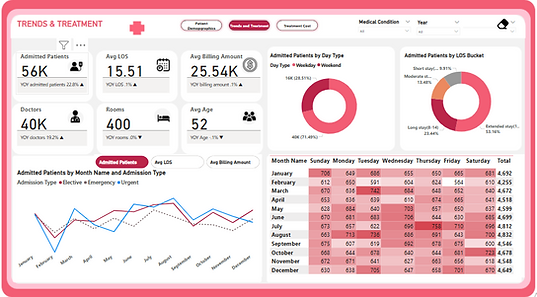
Trends and Treatments
This dashboard page evaluates hospital performance based on patient volume, test result outcomes, and treatment costs. It also explores which medications are most commonly prescribed for specific conditions and whether their use is consistent across hospitals. This information enables benchmarking between hospitals and reveals how treatment strategies and medication usage might impact patient outcomes. It's a key page for understanding clinical consistency and cost-effectiveness at the institutional level.
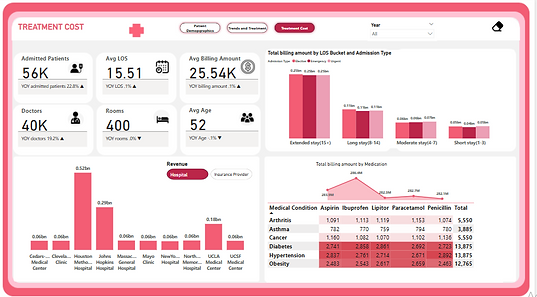
Treatment Cost
This third page dives into the most frequently diagnosed medical conditions and the average hospital stay length associated with each. It also compares treatment costs by condition and by type of admission. Users can see how long patients with different diagnoses typically remain in the hospital, and whether costs vary depending on whether the admission was planned, urgent, or emergency. This insight is valuable for identifying high-burden conditions and understanding where cost efficiencies or care improvements are most needed.