About Project
This project was created to analyze sales and profitability across a global skincare and beauty e-commerce store using an order dataset. The objective was to track key business KPIs, including a minimum 15% profit margin, 20% annual sales growth (with a target of 30% for the corporate segment), and achieving at least $ 400,000 in annual sales per market. The analysis was built using Microsoft Fabric, cleaned and modeled with Power Query, and visualized using Power BI to deliver clear, actionable insights.
The final report spans two pages and presents insights into total revenue, monthly trends, segment and market performance, as well as top-selling products. By exploring product categories, regional profitability, and customer segments, this dashboard equips decision-makers with the tools to optimize pricing, identify underperforming regions, and better target high-value customers.
Business Performance Overview
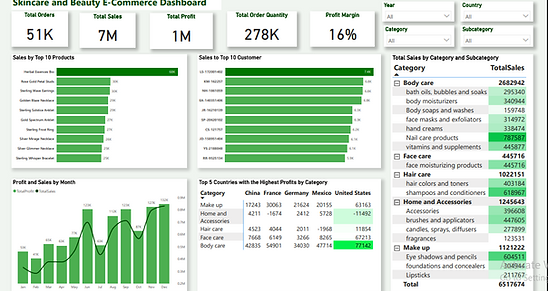
This page provides a high-level summary of business KPIs: total sales ($7M), total profit ($1M), and a 16% average profit margin, meeting the 15% target. Monthly trends in sales and profit, top product categories, and key customer insights are visualized to show where growth is happening. It also highlights best-performing products and top-spending customers, helping the business recognize what’s driving revenue.
NB: Click on the image below for a full view of the dashboard report.

Segment and Market Deep Dive
This page focuses on performance by customer segment (Consumer, Corporate, Self-Employed) and by regional markets (USCA, Europe, Asia Pacific, etc.). It evaluates whether each market is meeting the $400K annual sales goal and whether segments are on track to meet sales growth targets. Stakeholders can use this page to refine regional strategies and prioritize high-impact segments.
NB: Click on the image below for the full view of the dashbaord report.