Retail Store Analysis

Summary:
A retail company was struggling with profit leaks, excessive returns, and delivery delays. This project aimed to uncover what's driving these issues and provide actionable insights to help the business make faster, smarter decisions.
My Approach:
✅ Cleaned and normalized messy sales data
✅ Structured it using a star schema model
✅ Built dynamic DAX measures
✅ Designed a 3-page interactive Power BI dashboard
The report is split into three interactive pages:
-
Sales Performance Overview – Tracks category trends, profit margins, and KPIs
-
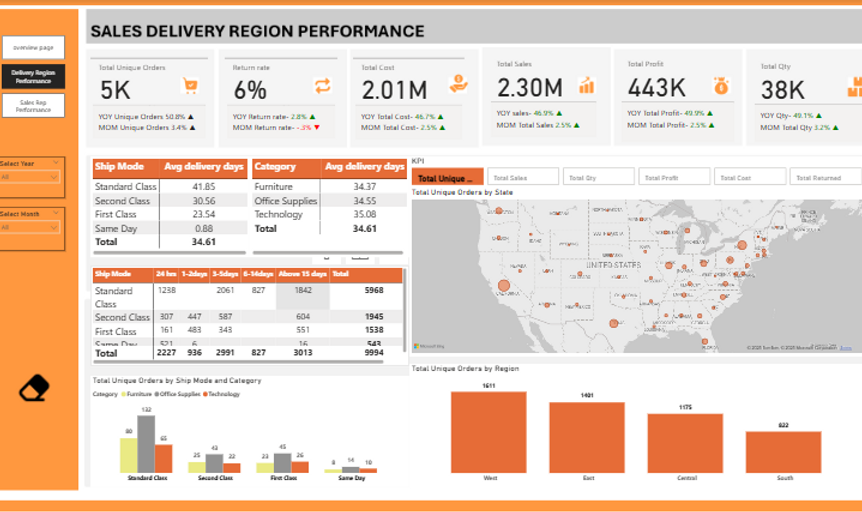
Sales & Delivery by Region – Highlights geographic patterns and shipping delays
-
Sales Rep Performance – Compares top reps, return rates, and customer impact
Key Insights:
📌 Technology = High Profit, Just 18% of sales volume drove 41% of profit
📌 Office Supplies = Return Magnet, Nearly 50% of all returns
📌 Shipping Delays = Standard delivery took up to 60+ days in some cases
📌 Consumer Segment =High volume, but also highest returns
📌 East Region= Most profitable, even though West had higher sales
Business Impact:
We delivered a clear, data-driven narrative with recommendations to:
→ Focus on high-margin product categories
→ Improve delivery timelines
→ Tackle quality issues
→ Build loyalty strategies for corporate buyers